Would you ever trade Amazon with a $1 stop?
I hope not, because on average, shares of Amazon move in a $76 daily range.
A $1 stop is just too darn tight for a stock like that – heck the spreads alone could be a few bucks… and a trade like that is almost certain to lose every time.
That said, most traders are aware of how silly it sounds… but when it comes to trading the derivatives market, traders make the silliest mistakes.
If you are one of those traders who has tried options and has failed, listen up.
Buying and selling options are not the same as trading stock. There is a time and volatility element involved that you need to be aware of.
If you ever bought an option… were right on your directional view… but lost money on the trade… it’s probably because you got the timing or volatility wrong.
Now, options trading platforms typically quote volatility in annualized terms. Which is super confusing, because most traders look at volatility in daily terms. For example, if Microsoft moves on average 2% a day…we know what that means. However, if you tell a stock trader that Microsoft is trading at annualized volatility of 32% … they will probably not know what the heck you’re talking about.
(Note: It’s okay if this doesn’t make sense right here because we go over how to use tools and tips like this in Weekly Money Multiplier.)
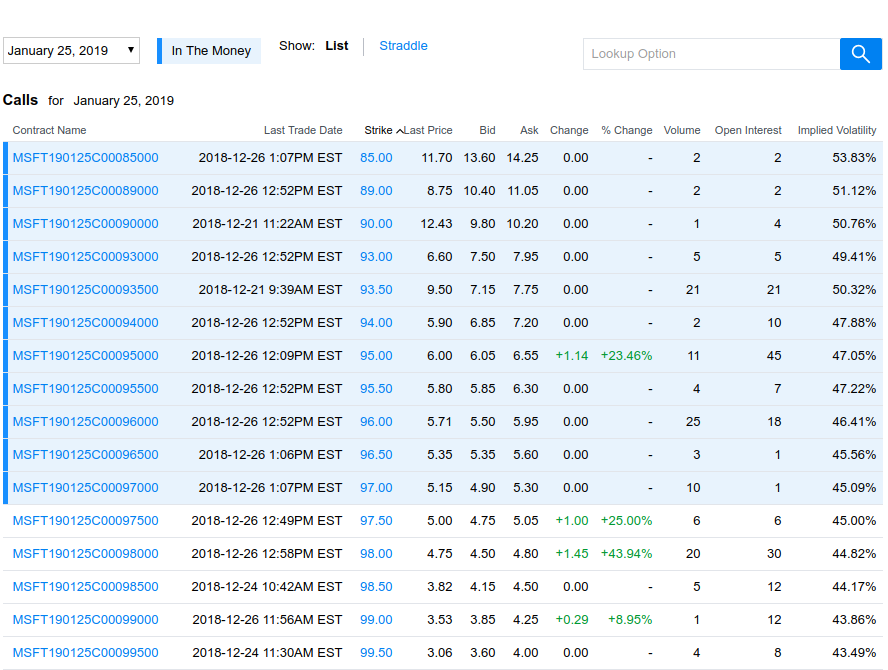
For example, some traders will look at this options chain in Microsoft and draw a blank.
But it’s simple, let’s say you wanted to buy the $95 strike price calls, expiring in about a month from now. Those are trading with an implied volatility of 47.05%. You would really only care about the volatility in the short-term right?
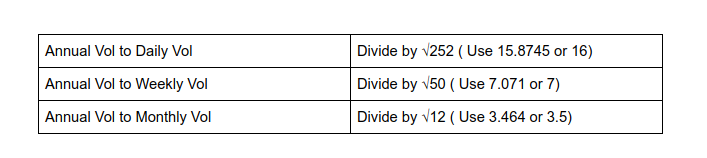
If you want to find out the daily volatility, you would divide the annualized figure by the square root of 252 (since there are 252 trading days in a year). Don’t worry, you can estimate the daily volatility and just divide by 16 (you can use 15.874 if you want to be more specific).
For example, the daily implied volatility is 2.96% (47.05% / 15874).
But what if you wanted to figure out how much Microsoft would move in a week?
Well, there are about 50 trading weeks in the year, so you would just divide the implied volatility by the square root of 50 (or 7.071).
That said, at this annualized volatility, Microsoft is expected to move around 6.65% (47.05% / 7.071) on a weekly basis.
Here’s a quick table for your reference:
Next time you’re looking at an options trade, take a look at the implied volatility and try to get a feel of what the market is anticipating. You could be buying options to rich. That said, you’ll be able to make a more informed decision after converting the volatility terms into something that makes sense.
Now, if you think this trick was helpful, I’ve got plenty more to share with you. In fact, you can catch me in the Millionaire Roadmap service.
You see, Weekly Money Multiplier has been a free add-on to Millionaire Roadmap this entire year… but come January, it becomes a standalone service.