When you see the Dow down 1,000 points for three days straight, it makes you wonder how anyone can make money on the long-side. But if you keep your eyes open, you’ll find a stock or two that dances to its own tune.
How do we find these elusive equities – these green shoots amongst a sea of red?
Fear not, I’m here to show you how!
— RECOMMENDED —
Introducing the brand new Weekly Money Multiplier… starring Nathan Bear

“I need to let you know I listened to your advice and focused only with Nate Bear setups and studied his material with my under 1K account. The month of February (2020) I was green $425 or 17% with 8 winners and 2 losers. This was my first green month this year.” ~ Dan
Last Thursday I managed to pick up over $2800 on AMD while the market was in a freefall.
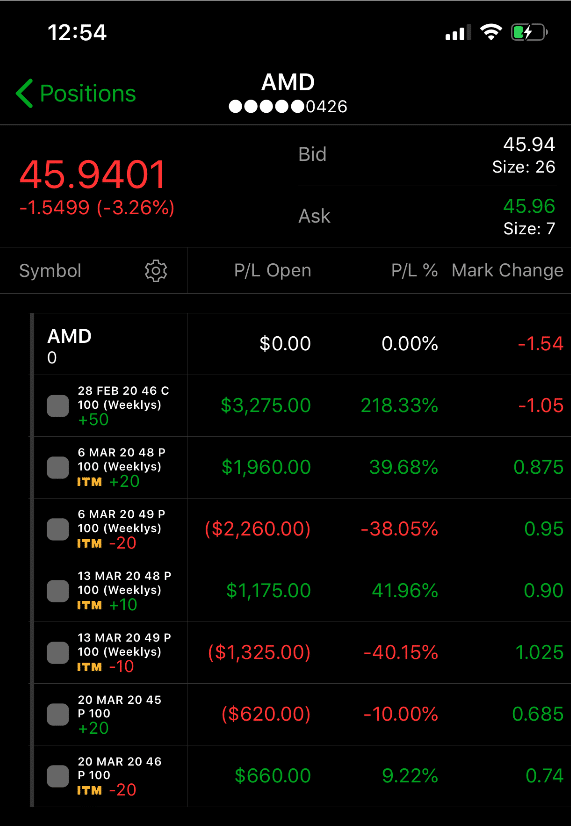
So how did I know exactly where to strike?
I recently wrote about the power of Bollinger Bands in trading. That article perfectly describes the setup for this trade.
But now I want to expand on those concepts and introduce you to some other techniques you may not be familiar with.
Learn them, and you too, could be staring at mean profits in no time.
Look for convergence in signals
Despite my best efforts, I never found one single indicator or pattern that worked by itself. Trading only works when you have different signals telling you to take the trade, and with this market, you want to get as many assurances as possible.
I like to classify my indicators into several categories.
- Static Levels: Fibonacci retracements, consolidation areas, or swing points all identify static levels. They point to prices that don’t change even as time goes on.
- Dynamic Levels: Most of us have heard of or use moving averages. I’m partial to the 21-period exponential moving average, the 8-period exponential moving average, and the 200-period simple moving average. These provide support and resistance. However, the price can change as time goes on. Bollinger Bands also fall into this category.
- Market Internals: I’m a big fan of looking at the overall market health when taking a trade. One of my favorite tools is the Tick chart. Other tools include advancing vs declining stocks, put to call ratio, and the VIX.
Regardless of which signals you deploy, choose ones from a few different categories. It’s like getting a second opinion from another doctor.
In the past few weeks, I have been in and out of Zoom Media (ZM) for trades. Like many IPOs, this stock doesn’t always trade with the rest of the market. Last week certainly proved that true. While the rest of the stocks skidded, ZM managed to finish a whopper of a week.
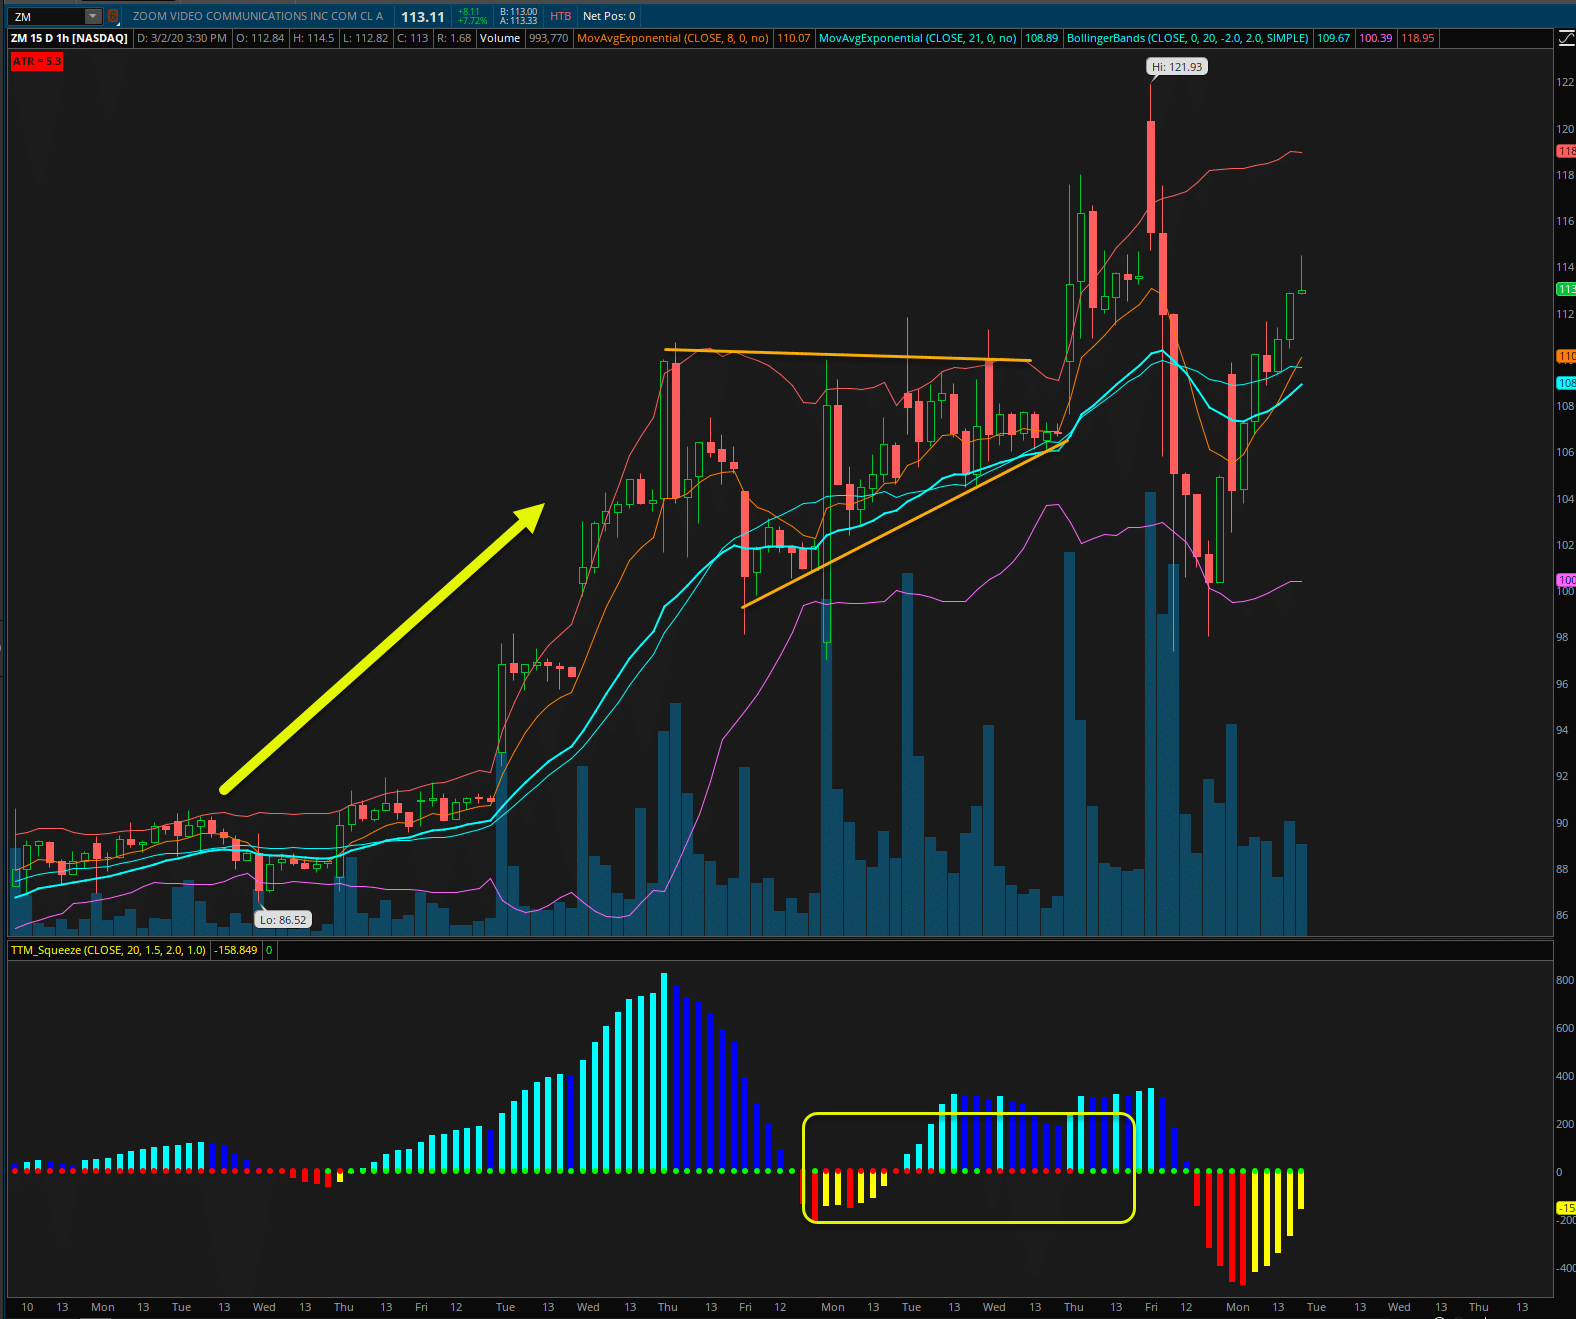
ZM Hourly Chart
And wouldn’t you know it, there was a TPS setup to boot!
It’s not too hard to find stocks that trade independent of the broader market. IPOs often will for the first year of their lives. You can get big names like UBER or LYFT declining with the overall market. But they’re much less likely to than a stock like Google.
I like to look for stocks that demonstrate relative strength compared to the rest of the market. Netflix is a good example from last week. While everything else was falling, Netflix managed to have a positive day among the wreckage.
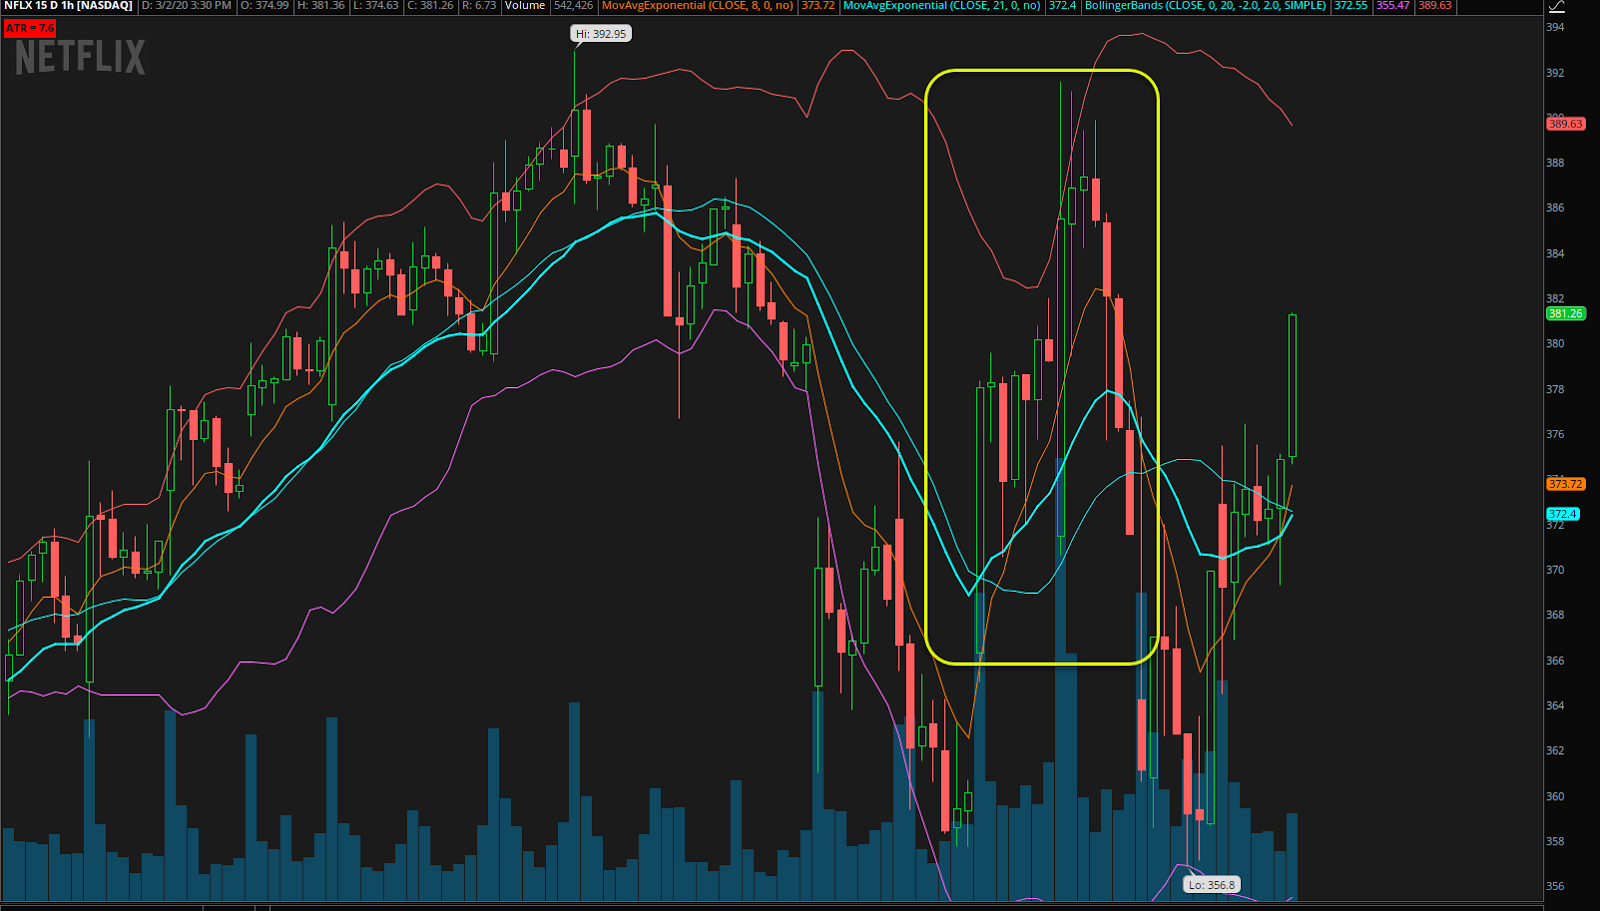
NFLX Hourly Chart
That’s a pretty solid run considering the market was down 1,000 points that day. When you see a big name stand out like that, you know some big money is coming to the table.
Normally, Netflix would get taken out with everything else simply because it’s part of many ETFs. Instead, you had a lot of money come into a large-cap stock and move it in the opposite direction. That tells me I want to keep an eye for a bull run here.
Look for an intraday reversal pattern
Long-term reversals start small. Before you see a turnaround on the daily chart, you’ll find it on the hourly chart.
Reversal patterns serve two major purposes. First, they give us a different signal from the others listed above that a stock is bottoming. Unlike those listed above, a reversal pattern develops from immediate price action. That heightens its relevance.
Secondly, reversal patterns give us a structure for our trades. Let’s say I find a reversal pattern on a key level that I’ve been watching. Now, I can use that pattern to define the parameters of my trade. I know exactly where my entries, targets, and stops are.
For example – let’s say I see a chart start closing above intermediate highs. I can use the recent lows as my stop. From there, I can use a symmetrical move or a Fibonacci extension to determine my targets. If I’m selling a credit spread, then I only need to worry about the stops.
Know your strengths
It took me 8 years of hard work before I finally found my trading strategy. I know I’m not going to be able to trade every market. But I’m confident in my ability to consistently turn profits.
In my upcoming webinar, I walk through the steps I took to build out my plan that eventually led me to take my $38,000 account and turn it into over $2,000,00 in two years. You can use these same steps to create your own strategies and turn significant profits.
Click here to register for my free training session.
Source: Weeklymoneymultiplier.com | Original Link